7.1.2 Analysing Rate of Reaction from Graph
Revision Progress
0% Complete
- In a chemical reaction,
- the reactants will decrease over time
- the product will increase over time.
- the rate of reaction will decrease over time owing to the decrease in concentration and total surface area of reactants.
- In a graph of quantity of product/reactant over time, the rate of reaction is equal to the gradient of the graph.
Example
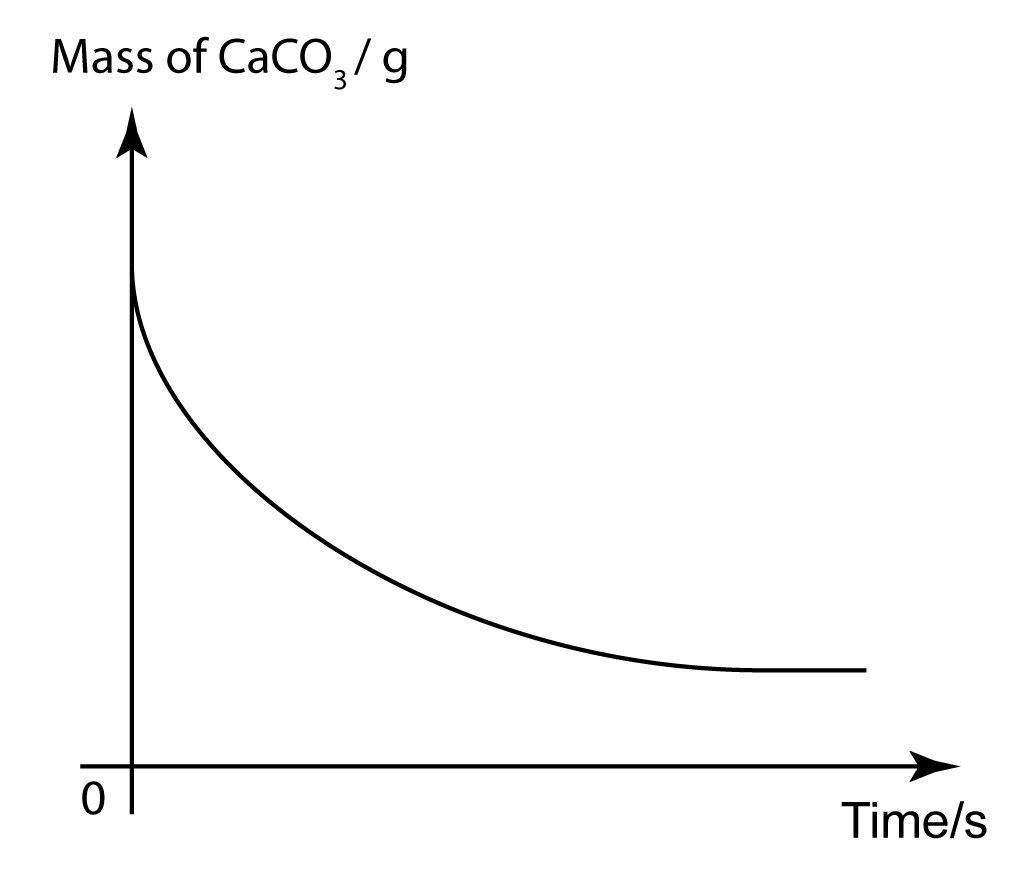
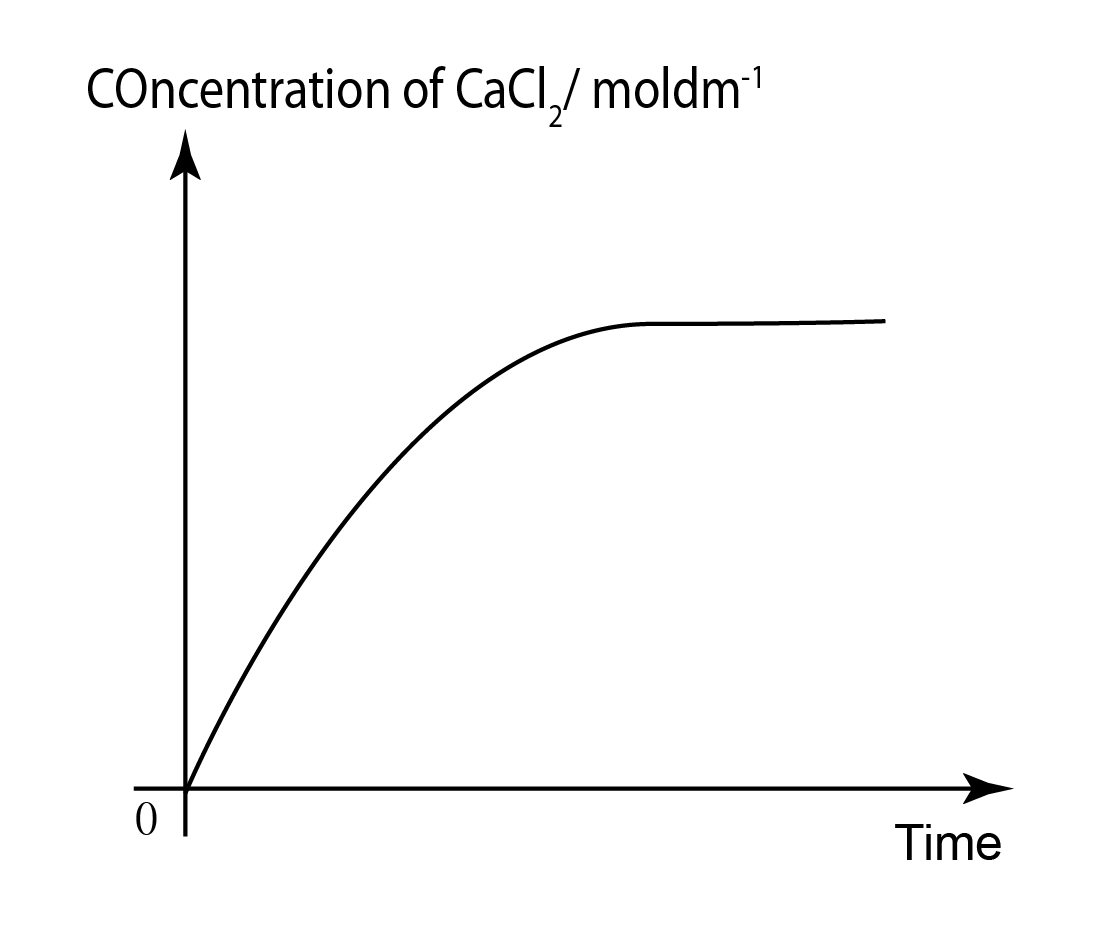
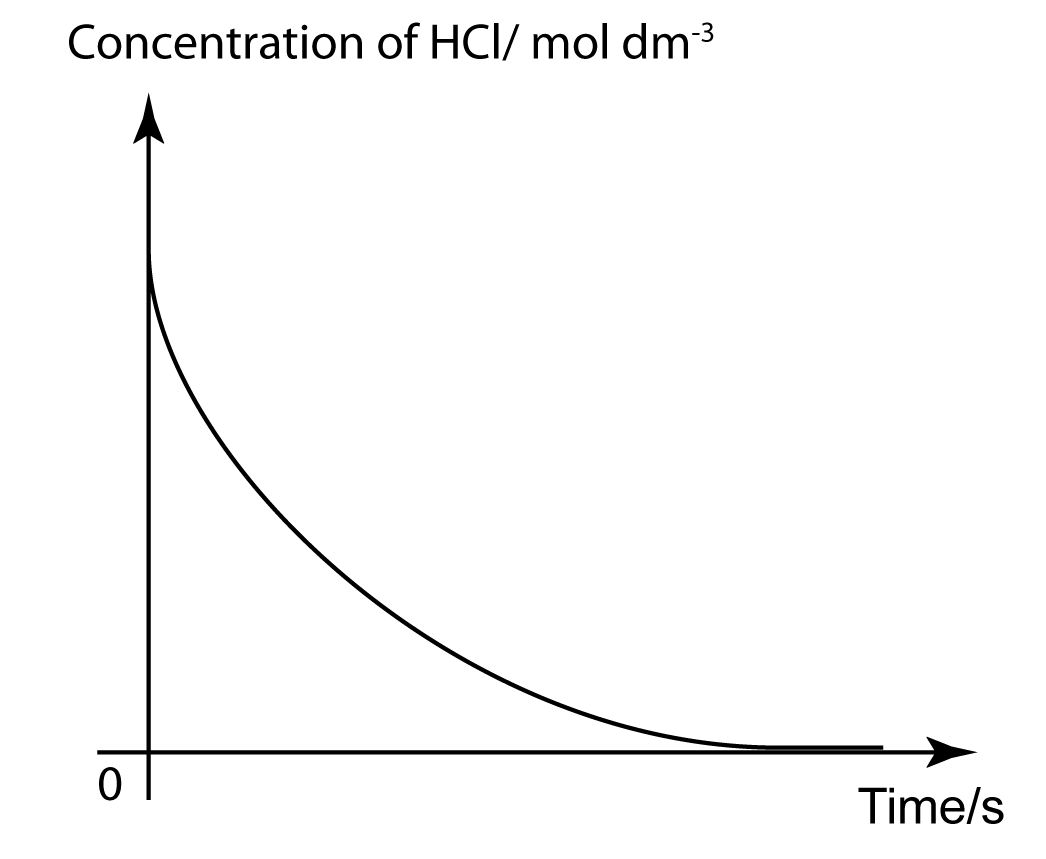
The reaction between dilute hydrochloric acid and excess marble will produce calcium chloride and gas of carbon dioxide. Sketch the graph of
- the mass of the marble against time.
- the volume of carbon dioxide against time.
- the concentration of hydrochloric acid against time.
- the concentration of calcium chloride against time.
Answer:
a.
b.

c.
d.
Example
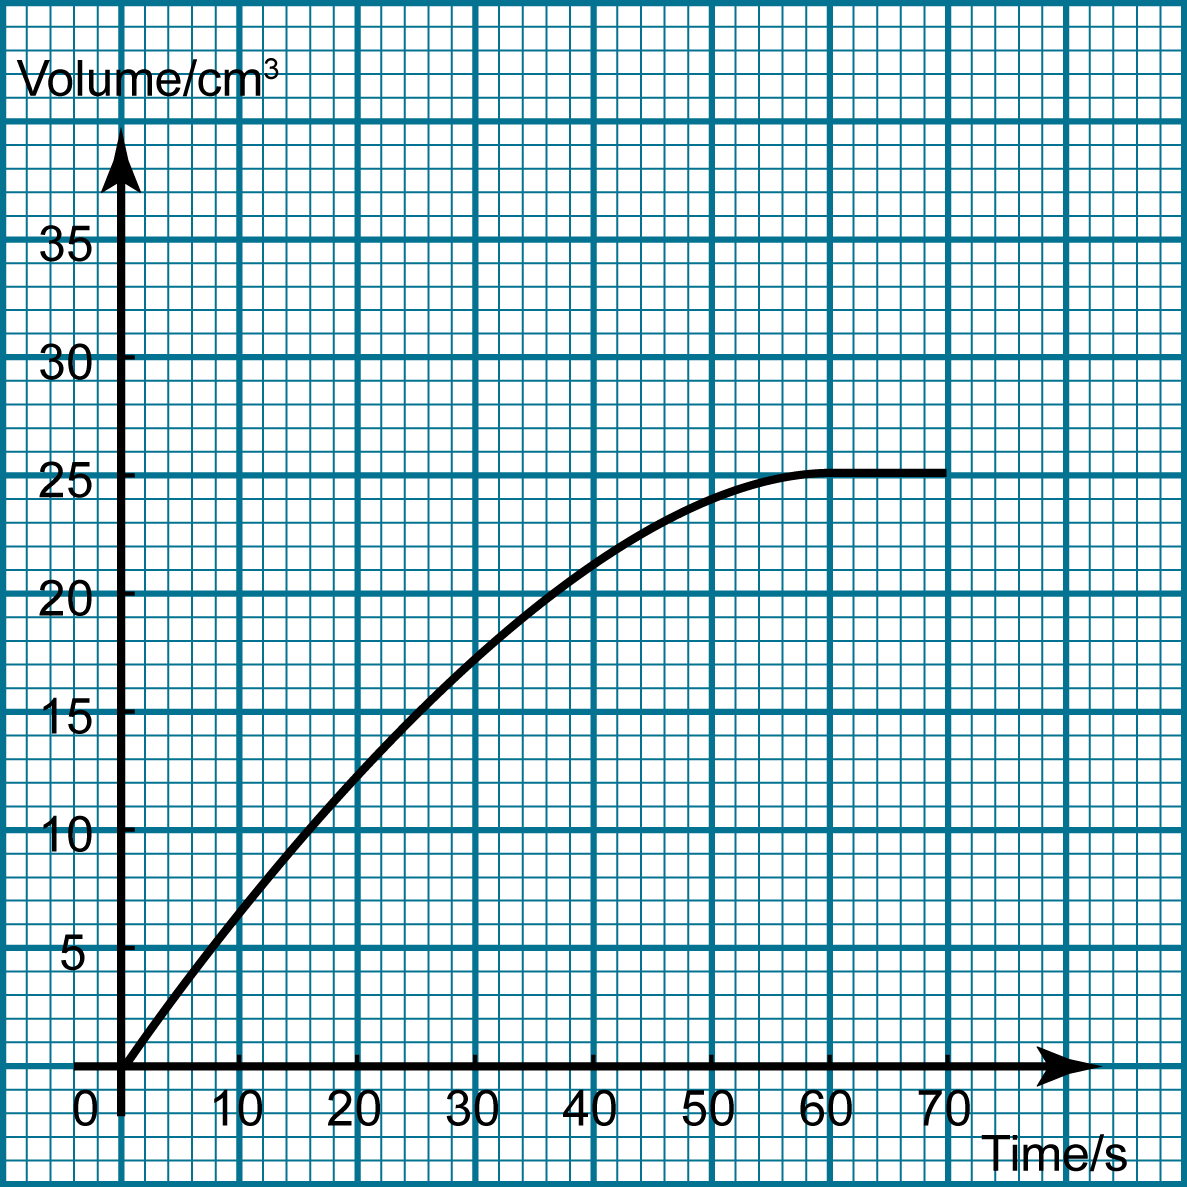
In a reaction between calcium carbonate and liquid hydrochloric acid, carbon dioxide gas that is released is collected in a burette. The graph shows the volume of carbon dioxide collected over time. Find the average rate of reaction in the first 60s.
Answer:

- The rate of reaction changes from time to time as the reaction happens.
- The rate of reaction at a particular time is called the instantaneous rate.
- The instantaneous rate of a reaction is equal to the gradient of tangent at a particular time.
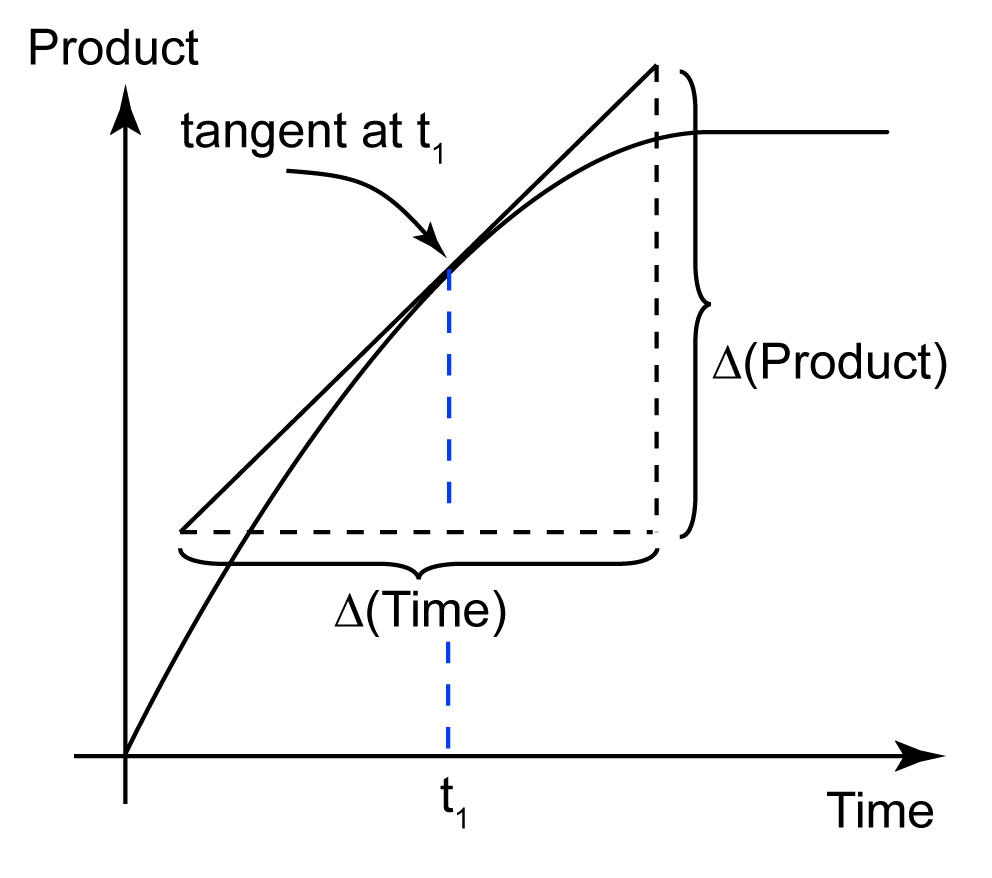
Rate of reaction = Δ(product) Δ(Time) Δ(Product) = Change of the amount of product Δ(Time) = Change of the time
Example
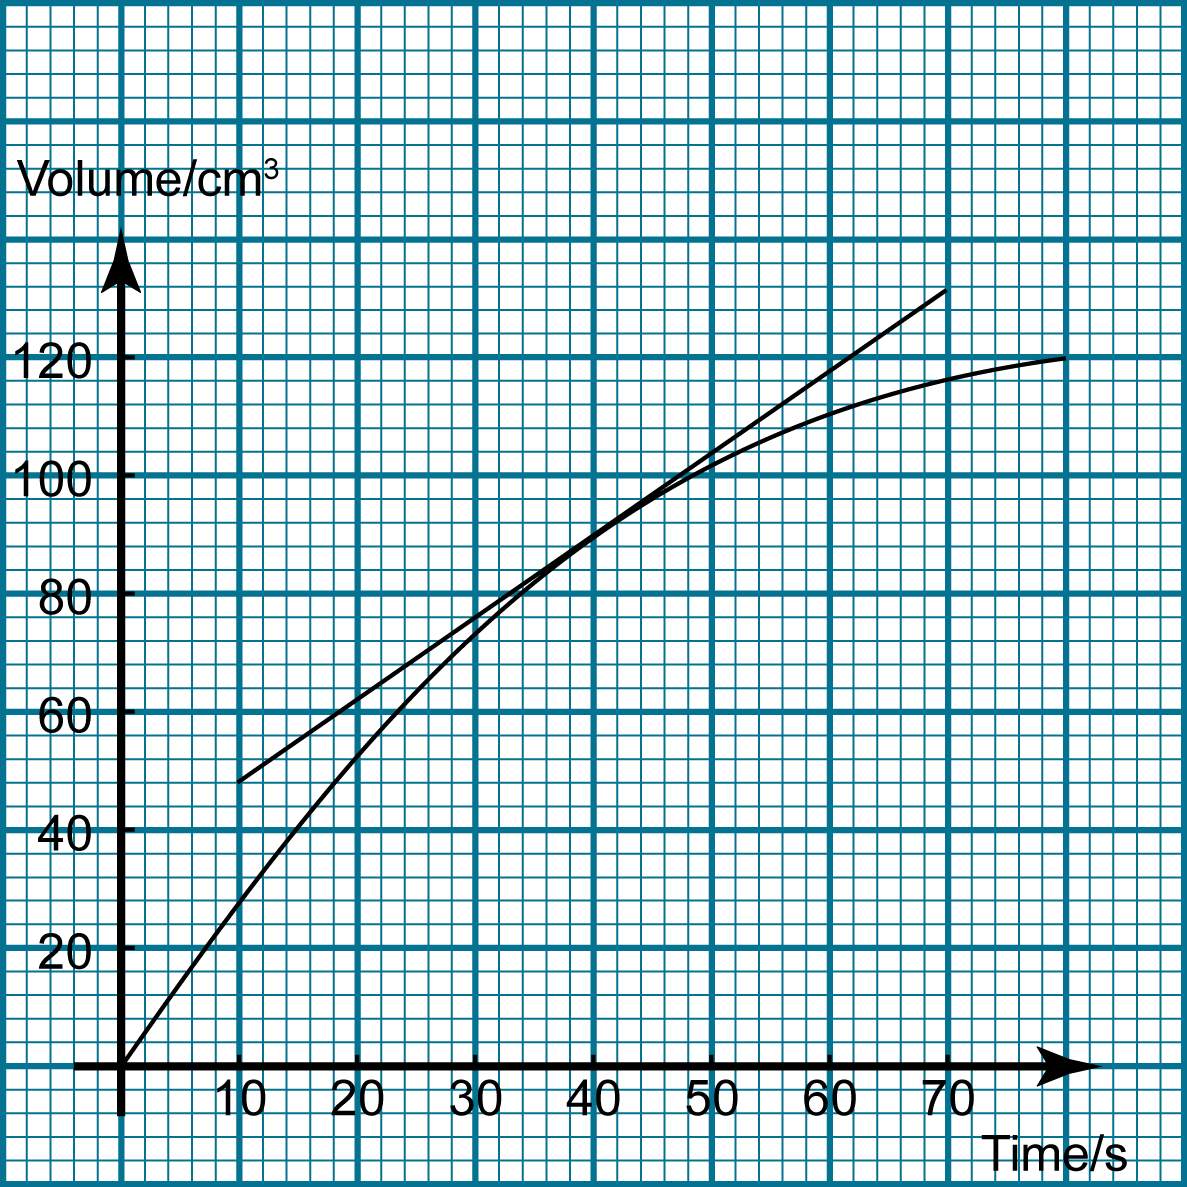
The graph shows the volume of carbon dioxide gas released over time in a chemical reaction. Find the rate of reaction at t = 40s.
Answer:

Rate of reaction at 40s = gradient of the tangent at 40s
Rate of reaction = 132-48 70-10 =1.4c m 3 s -1